By Gerhard Knothe
ARS, USDA, NCAUR, Peoria, Illinois 61604
(To whom correspondence should be addressed at NCAUR, ARS, USDA, 1815 N. University St., Peoria, IL 61604. E-mail: knothegh@mail.ncaur.usda.gov)
Presented in part at the 89th AOCS Annual Meeting & Expo, Chicago, IL, May 1998.
Copyright © 1999 by AOCS Press
Abstract
Vegetable oil esters, particularly methyl esters, are being explored and used as alternative diesel fuel (biodiesel). The transesterification reaction which yields the methyl esters can be monitored for completion by near-infrared (NIR) spectroscopy using a fiber-optic probe. Although the NIR method is less sensitive than gas chromatography (GC) for quantifying minor components, by correlation with existing GC or other analytical data, biodiesel fuel quality can be assessed through the NIR method. The NIR method is easier and faster to use than GC.
Paper no. J9071 in JAOCS 76, 795-800 (July 1999).
Key Words: Biodiesel, fiber-optic probe, fuel quality, near infrared spectroscopy, transesterification.
Biodiesel, defined as the monoalkyl esters of fatty acids from vegetable oils and animal fats (1), neat and blended with conventional diesel fuel has significant potential as alternative diesel fuel (2, 3). Initial stages of commercialization have been successful. Biodiesel is usually obtained from the neat vegetable oil by transesterification with an alcohol, usually methanol, in presence of a catalyst, usually a base such as KOH (Fig. 1). Glycerol is a by-product of the reaction. Other possible materials in biodiesel include residual alcohol, moisture, unreacted feedstock (triacylglycerides), incompletely reacted mono- and diglycerides, and free fatty acids.
Fuel standards have been developed in Austria (ÖNORM C 1190), Germany (DIN 51606) and Italy (UNI 10635:1997), and in the United States a provisional ASTM (American Society for Testing and Materials) standard has been completed. The fuel standards address quality issues of biodiesel by limiting materials such as free and total glycerol (total glycerol is the sum of free glycerol and glycerol bound as mono-, di-, and triacylglycerides), water (moisture), free fatty acid (by limiting the acid number), and residual alcohol (by limiting the flash point). These materials need to be limited in biodiesel because their presence can lead to fuel deterioration during storage as well as to significant operational problems such as engine deposits. The rationale for various quality test methods in biodiesel standards (United States, Austria) has been discussed (4, 5).
The analysis of biodiesel for various contaminants is usually conducted by gas chromatography (GC). Originally, a method for analyzing mono-, di-, and triacylglycerides together with methyl esters in one run was developed (6). This method was extended to include glycerol (7). Other papers also report on the GC analysis of biodiesel for determining contaminants such as methanol, glycerol, and glycerides (8-13). Biodiesel was also analyzed by GC for minor components such as sterols (14, 15). Preseparation of biodiesel and its contaminants by high-performance liquid chromatography (HPLC) prior to GC was reported (16). However, other methods have been utilized in the analysis of biodiesel, including HPLC with density detection (17) or pulsed amperometric detection for determining glycerol (18), and viscosity (19).
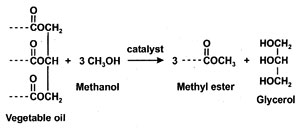
Fig. 1. Transesterification reaction.
On the other hand, spectroscopic methods are being increasingly utilized for quality control purposes. Near-infrared (NIR) spectroscopy is among the methods finding increased use. Operational ease, rapidity of measurement, and nondestructiveness are among the chief reasons for this development besides accuracy and reliability. NIR spectroscopy is now being used routinely for analyzing the fatty acid composition of oilseeds besides finding other applications in the field of fats and oils (20, 21). To the best of our knowledge, the NIR spectra of numerous fatty compounds were first reported more than 40 years ago (22). Several other papers discuss NIR spectra of long-chain compounds (23-25). Here we report differences in the NIR spectra of vegetable oils (soybean oil used as example here) and their methyl esters as well as initial results on the potential use of these spectral differences to monitor progress and endpoint of the transesterification. A model system consisting of defined concentrations of contaminants in biodiesel was used. By induction, biodiesel fuel quality can be assessed. NIR can be an alternative not only to GC but to other methods in biodiesel standards, for example flash point. Testing biodiesel for every such specification in the standard is a lengthy and extremely expensive process. A method such as NIR can shorten this process and render it considerably less expensive. Spectra were obtained with the aid of a fiber-optic probe, which makes the use of NIR spectroscopy particularly easy.
Experimental Procedures
Biodiesel (methyl soyate) complying with biodiesel fuel specifications and the corresponding feedstock (soybean oil) were obtained from NOPEC Corp. (Lakeland, FL) or Ag Environmental Products ("Soy Gold;" Lenexa, KS) or Twin Rivers Technology (Quincy, MA). These materials were used as received. Methyl ester quality was checked by nuclear magnetic resonance (NMR) spectroscopy (Bruker ARX-400 spectrometer; Bruker, Rheinstetten, Germany; 400 MHz for 1H NMR and 100, MHz for 13C NMR; solvent CDCl3) because this method will yield information on all possible contaminants from one sample. No significant contaminants were observed and these materials were treated as 100% methyl esters for purposes of this study. Free fatty acids were obtained from Nu-Chek-Prep (Elysian, MN; purity >99%). Methanol and glycerol were from Fisher Scientific (Fairlawn, NJ).
NIR spectra were obtained on a Perkin-Elmer (Norwalk, CT) Spectrum 2000 spectrometer equipped with a Galileo (Sturbridge, MA) transmission-type fiber-optic probe. Quantitation methods were developed on a personal computer (Spectrum 2000 and Quant+ software; Perkin-Elmer). Method calibrations were carried out automatically by using the corresponding software feature.
Samples were prepared in a beaker by mixing methyl esters with defined quantities of contaminants. After each addition of contaminant within a series of measurements, the mixture was stirred for 5 min and again for several minutes with the probe immersed. Then the spectrum was recorded. After every series of measurements, the fiber-optic probe was cleaned by successive treatment with ethanol and acetone by immersing into each stirred solvent for several minutes.
For quantitation in wt% (most contaminants in biodiesel are limited in wt%), densities were taken into account by determining the weight of 10 mL material (average of three measurements; temperature 22 deg C) or using literature data. Densities were 0.87104 for methyl soyate and 0.9092 for soybean oil. Values for glycerol (1.2613 20/4) and methanol (0.7914 20/4) were taken from the literature (26). Our measurements for glycerol and methanol agreed excellently with these values, thus indirectly confirming the validity of the determinations for methyl esters and soybean oil feedstock.
Results and Discussion
The NIR spectra were determined with a fiber-optic probe, which makes their acquisition especially easy and provides the possibility of developing on-line reaction monitoring. Fiber-optic probes are currently used for monitoring commercial reactions (27-29) in applications similar to the one presented here. In conjunction with biodiesel, fiber-optic technology has up to the present only been used for determining the amount of biodiesel in lubricating oil by monitoring carbonyl absorption at 1820-1860 cm-1 in the mid-infrared region (30).
Spectra were determined of solutions of predetermined concentration of feedstock (or other contaminants) in methyl soyate. The solution (approximate volume 100 mL) was prepared in a beaker into which a fiber-optic probe was immersed so that the path of the beam passed through the solution. This method proved advantageous in terms of ease of sample preparation. Concentration ranges of contaminants were also considered beyond those specified in biodiesel standards in order to demonstrate the potential of the method for monitoring the transesterification reaction. All spectra were recorded at ambient temperature (22-24 deg C), although the transesterification reaction is usually conducted at an elevated temperature (60 deg C). Temperature dependence of NIR spectra has been discussed but this affects mainly determinations of hydroxyl values as these are influenced more by temperature-sensitive hydrogen bonding (27) and less by the peaks used here for quantitation.
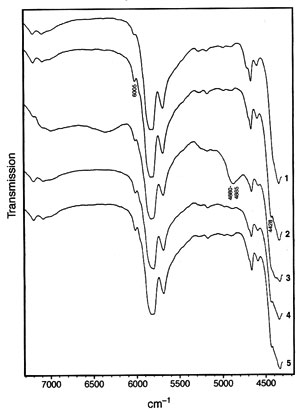
Fig. 2. Near-infrared spectra in the region 7300-4300 cm-1 of (1) soybean oil (feedstock); (2) methyl soyate; (3) methyl soyate contaminated with methanol (80 mL methyl soyate, 20 mL methanol corresponding to 81.49 wt% methyl soyate and 18.51 wt% methanol); (4) methyl soyate contaminated with glycerol; (5) methyl soyate contaminated with free fatty acid. The wavenumbers of some salient peaks useful for quantitation as discussed in the text are noted.
While the mid-range infrared spectra of triacylglycerides (vegetable oils) and their corresponding methyl esters are very similar, the NIR spectra of triacylglycerides (soybean oil used here) and the corresponding methyl esters (methyl soyate) reveal two distinct possibilities for distinguishing them. While one of the distinguishing signals, at 4425-4430 cm-1, was indicated in an early paper on NIR of fatty compounds (22), a second signal at 6005 cm-1 has apparently not been reported previously. Figure 2 depicts the NIR transmission spectra of soybean oil (also referred to as feedstock in this paper) and methyl soyate as well as methyl soyate containing some contaminants in the range of 4300-7300 cm-1. In both regions, the methyl ester displays peaks while the triacylglyceride-containing soybean oil exhibits shoulders [note that ethyl esters apparently display a strong shoulder at 4425-4430 cm-1 (22)].
Both peak regions, 4425-4430 (indicated as 4428 cm-1 in Fig. 2) and 6005 cm-1 can be used for quantitation. Partial least-squares (PLS) analysis of the NIR spectra converted to the absorbance mode (note that transmission spectra are depicted in Fig. 2) was applied for quantitation. The software used offered the choice of two PLS approaches for calibration. The first PLS calibration models the spectra by a different set of factors for each component and the concentration values by the respective factors (i.e., the number of calibrations corresponds to the number of sample components). The second PLS calibration models the spectra by one set of factors and each component is modeled by relating the concentration values to those factors. The first PLS calibration method was applied with excellent results.PLS calibration for NIR spectra obtained by means of a fiber optic probe has been applied to other (trans-)esterification reactions. These include the synthesis of di- and trifunctional esters from multifunctional alcohols and excess fatty acid or methyl ester by monitoring the hydroxyl and, in case of acids, the acid value (27), determining the shift of the OH absorption band in NIR during polyester production (28), monitoring the transesterification of methyl esters with polyethylene glycol 300 (PEG 300) to give the corresponding PEG 300 ester (29), and monitoring epoxide and hydroxyl values in polymerization of a polyol (31). Polyol production monitoring by NIR using a fiber-optic probe and PLS calibration was also the subject of a patent application (32). Other authors determined various fat index values by NIR principal component analysis (33).
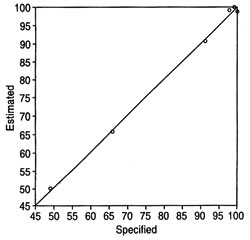
Fig. 3. Plot of estimated (by calibration) vs. specified values for a method quantitating feedstock in methyl esters for the peak at 6005 cm-1. Partial least-squares fit conducted after conversion of spectra to absorbance. Spectral region used for method: 6050-5850 cm-1. Samples used in the method: neat methyl esters and contaminated samples ranging from 51 wt% to 0.04 wt% soybean oil (some datapoints omitted to reduce congestion).
The region of the spectrum around the peaks giving the best results for calibration needs to be determined empirically. The regions used in the examples provided here are given in the corresponding figures or tables. Altering the region can lead to poorer results for a specific set of samples. Using a very large spectral region for quantitation leads to unacceptable results, likely because the overall differences in the spectra of the oil and its esters over this large region are too small. Figure 3 depicts a plot of specified (the term "specified values" pertains to the known composition of a sample) vs. estimated values (in wt%; the term "estimated values" pertains to the composition of a sample in a method as determined during the calibration of the method) for methyl esters in a methyl ester/feedstock mixture resulting from a method calibration. The number of methods m that can be set up from n spectra in a series of measurements for a given set of parameters is as follows:
![]()
when the minimum number of spectra required for a method is nmin. With adjustments to wavenumber range and other parameters, the number of theoretically possible methods increases considerably. Many of these methods will yield similarly excellent calibration and prediction results. Only a few methods were developed and some examples are reported here.
Table 1
Specified and Predicted Amounts of Feedstock (soybean oil) in Methyl Soyate (biodiesel)a
Peak (cm-1)
6005
6005
6005
6005
6005
4428b
4428
4428
4428
6005c
6005c
6005c
6005c
a Method calibration for peak at 6005 cm-1. Results obtained by method described in the text.
b Spectral region used for calibration 4600-4350 cm-1.
c Methyl esters contaminated with feedstock and glycerol. Feedstock values reflect total contaminants (wt% feedstock + wt% glycerol). Same calibration method used as in the nonglycerol entries for 6005 cm-1.
d The first value reflects feedstock, the second one glycerol. For purposes of prediction in the next column, both materials treated as one contaminant. For the effect of glycerol and mono- and diglycerides on the near-infrared spectra, see text.
Table 1 compares specified values of methyl ester/feedstock samples not contained in the method (but run in the same sample series) with values predicted (the term "predicted values" pertains to samples of known composition being treated as unknown for purposes of testing the method) from their spectra. For purposes of prediction, a sample of known composition was treated as being of unknown composition and then the predicted values were compared to the known composition values. In both cases (calibration plots and prediction of unknown samples) excellent correlation of specified with estimated or predicted values is obtained. It must be noted, however, that while the correlations of specified to predicted values are statistically very good to excellent even for high methyl ester to feedstock ratios, they are within experimental error at these high ratios. Therefore, the NIR method cannot presently be used for exactly quantifying the low amounts of residual contaminants in vegetable oil alkyl esters as called for in biodiesel standards. Note that NIR techniques in general are currently not suitable for determining trace amounts of contaminants (34). This can be circumvented by checking the results of initial transesterification reactions by GC and other methods called for in biodiesel standards and correlating them to NIR. When in further transesterification reactions after the specified reaction time, NIR results indicate excellent agreement of standard ester (biodiesel) spectra with sample spectra, the formation of vegetable oil alkyl esters conforming to biodiesel standards can be assumed. Furthermore, the transesterification reaction can be sampled while in progress, as samples run with contaminant concentrations above fuel specification levels show. If NIR analytical results show that the reaction is progressing along the known path to esters meeting biodiesel fuel specifications, this provides additional confirmation that the resulting products will meet fuel specifications.
The quality of the predicted values was checked in the prediction report generated by the quantitation software by the M-distance and residual ratio. Ideally, these values should be <1 and <3, respectively, indicating that the sample whose composition is being predicted is representative of the samples used in the calibration set. In most examples investigated here, these conditions were met but even in samples where one (or both) parameters exceeded the ideal values, excellent correlations of specified with predicted values could be attained.
Table 1 contains some results from the quantitation of soybean oil feedstock in methyl soyate. Most specified and predicted values are in excellent agreement. At low contamination levels as prescribed in biodiesel standards, it must be kept in mind that even statistically excellent results can translate into deviations from the desired fuel specifications. Although, as discussed above, different kinds of contaminants can be present in the product of the transesterification reaction, they do not alter the peak regions for distinguishing methyl esters and feedstock triacylglycerides (see Fig. 2). However, effects such as baseline depression apparently play a role at higher concentrations of additional contaminants and can play a role in quantitation. Baseline depression is observed in the spectra obtained with amounts of glycerol significantly beyond those in biodiesel fuel specifications. This is a result of the very low solubility of glycerol in biodiesel (13) which leads to a two-phase system. Similar observations hold for samples containing mono- and diglycerides. These observations would need to be accounted for when considering NIR spectroscopic online monitoring of the transesterification reaction. Thus, the results when taking the additional contaminants into consideration show somewhat more deviation from specified values with the deviation being lower when the additional contaminants are present in low concentrations. This deviation is likely due to the insolubility of some of these contaminants (e.g., glycerol) in the methyl esters. The deviation is lower when the additional contaminants are present in low concentrations. Some examples of methyl ester/feedstock samples containing glycerol as additional contaminant are also listed in Table 1. Nevertheless, the results show that for purposes of reaction monitoring and endpoint determination, the problem can be largely reduced to determining the turnover from feedstock to methyl esters without determining all contaminants.
Specified and Predicted Amounts of Methanol in Methyl Soyate(a)
Methyl esters (wt%)
Methanol (wt%)
Specified
Predicted
Specified
Predicted
81.49b
82.98
18.51
17.02
99.55
99.28
0.45
0.72
99.73
99.52
0.27
0.48
99.82
99.64
0.18
0.36
99.95
99.93
0.04
0.07
a Calibration region 5500-4600 cm-1. Samples in calibration method: 88.01, 99.10, 99.55, 99.91. 99.99 wt% methyl soyate, remainder methanol.
b Methanol "overload" (18.51 wt%). The molar ratio methanol/vegetable oil of 6:1 used in transesterification reactions (see text) corresponds to approximately 17.9 wt% methanol at the beginning of the reaction.
Methanol in methyl esters can be determined in a fashion similar to feedstock. Curve 3 in Figure 1 depicts methyl soyate biodiesel containing a significant amount of methanol [actually the spectrum contains an overload of methanol (18.5 wt%) which is not attained at any stage of the transesterification reaction when using the molar ratio as described in the literature (35, 36)]. It serves to show, however, that when carrying out on-line monitoring, the spectra of the feedstock and the methyl ester will not be "overpowered" by a strong methanol spectrum. The methanol causes a relatively broad peak at 4480-4885 cm-1, as well as a depression of the baseline in the range of 7000-6200 cm-1. The peak at 4480-4885 cm-1 can be used for quantitation in the fashion discussed above by converting the spectra to absorbance with subsequent PLS evaluation as described for the feedstock. Some results are given in Table 2. Thus, besides being an alternative to GC determinations, NIR spectroscopy can also be an alternative to flash point evaluations in a similar inductive fashion as in the case of residual feedstock. Methanol has a flash point of 11 deg C, which could lead to safety and handling concerns. Thus, the limit for flash point in biodiesel standards is >100 deg C or 0.2 wt% (5).
Modified transesterification process
The transesterification reaction is usually conducted with a molar ratio methanol/vegetable oil of 6:1 based on kinetic and mechanistic studies (35, 36). More recently, some aspects of this work have been questioned (37-39). Modifications in the kinetics of the reaction would not have any major influence on reaction monitoring as discussed here. However, in two of the papers (36, 37) it was claimed that the presence of "inert cosolvents" such as tetrahydrofuran or methyl tert-butyl ether and increasing the methanol/vegetable oil ratio considerably accelerates the transesterification reaction, leading to cost and efficiency improvements. Such a procedure would obviously have implications for biodiesel standards (not only methanol, but also ether cosolvent content would need to be addressed) and the NIR spectroscopic monitoring discussed here. The transesterification reaction in presence of ether cosolvents, however, also presents some significant problems not mentioned in the literature (36, 37). The most salient problems are safety considerations when handling ethers and the higher price of ethers. A more expensive cosolvent could be a significant additional factor in the cost of already inherently expensive biodiesel. Therefore, the impact of the cosolvent procedure on the commercial transesterification reaction and any reaction monitoring by NIR or other methods remains to be seen and accordingly was not taken into account in this study.
Acknowledgments
The author thanks Marvin 0. Bagby for inspiring this work, Michelle L. McElvaine and Lisa A. Nolen for patiently recording the numerous NIR spectra, David Weisleder for obtaining NMR spectra, and NOPEC Corp., Ag Environmental Products and Twin Rivers Technology for providing samples of their biodiesel products and/or feedstock.
References
1. Anon., Biodiesel ASTM Standard Under Consideration, Biodiesel Report, published by the National Biodiesel Board, Jefferson City, MO, March 1996.
2. Knothe, G., R.O. Dunn, and M.O. Bagby, Biodiesel: The Use of Vegetable Oils and Their Derivatives as Alternative Diesel Fuels, in ACS Symp. Ser. 666 (Fuels and Chemicals from Biomass), American Chemical Society, Washington, DC, 1997, pp. 172-208.
3. Dunn, R.O., G. Knothe, and M.O. Bagby, Recent Advances in the Development of Alternative Diesel Fuels from Vegetable Oils and Animal Fats, Recent Res. Devel. Oil Chem. 1:31-56 (1997).
4. Howell, S., U.S. Biodiesel Standards -- An Update of Current Activities, Soc. Automot. Eng. Technical Paper Ser. 971687, SAE, Warrendale, PA, 1997.
5. Mittelbach, M., Diesel Fuel Derived from Vegetable Oils, VI: Specifications and Quality Control of Biodiesel, Bioresource Technol. 56:7-11 (1996).
6. Freedman, B., W.F. Kwolek, and E.H. Pryde, Quantitation in the Analysis of Transesterified Soybean Oil by Capillary Gas Chromatography, J. Am. Oil Chem. Soc. 63:1370-1375 (1986).
7. Plank, C., and E. Lorbeer, Simultaneous Determination of Glycerol, and Mono-, Di- and Triglycerides in Vegetable Oil Methyl Esters by Capillary Gas Chromatography, J. Chromatogr. A 697:461-468 (1995).
8. Mittelbach, M., Diesel Fuel Derived from Vegetable Oils, V [I]: Gas Chromatographic Determination of Free Glycerol in Transesterified Vegetable Oils, Chromatographia 37:623-626 (1993).
9. Mittelbach, M., G. Roth, and A. Bergmann, Simultaneous Gas Chromatographic Determination of Methanol and Free Glycerol in Biodiesel, Ibid. 42:431-434 (1996).
10. Cvengros, J., and Z. Cvengrosová, Quality Control of Rapeseed Oil Methyl Esters by Determination of Acyl Conversion, J. Am. Oil Chem. Soc. 71:1349-1352 (1994).
11. Cvengrosová, Z., J. Cvengros, and M. Hronec, Rapeseed Oil Ethyl Esters as Alternative Fuels and Their Quality Control, Petroleum Coal 39:36-40 (1998).
12. Mariani, C., P. Bondioli, S. Venturini, and E. Fedeli, Vegetable Oil Derivatives as Diesel Fuel. Analytical Aspects. Note 1: Determination of Methyl Esters, Mono-, Di-, and Triglycerides, Riv. Ital. Sostanze Grasse 68:549-551 (1991).
13. Bondioli, P., C. Mariani, A. Lanzani, E. Fedeli, and S. Veronese, Vegetable Oil Derivatives as Diesel Fuel Substitutes. Analytical Aspects. Note 2: Determination of Free Glycerol, Ibid. 69:7-9 (1992).
14. Plank, C., and E. Lorbeer, Minor Components in Vegetable Oil Methyl Esters I: Sterols in Rape Seed Oil Methyl Ester, Fett Wiss. Technol. 96:379-386 (1994).
15. Plank, C., and E. Lorbeer, On-line Liquid Chromatography -- Gas Chromatography for the Analysis of Free and Esterified Sterols in Vegetable Oil Methyl Esters Used as Diesel Fuel Substitutes, J. Chromatogr. A 683:95-104 (1994).
16. Lechner, M., C. Bauer-Plank, and E. Lorbeer, Determination of Acylglycerols in Vegetable Oil Methyl Esters by On-Line Normal Phase LC-GC, J. High Resolut. Chromatogr. 20:581-585 (1997).
17. Trathnigg, B., and M. Mittelbach, Analysis of Triglyceride Methanolysis Mixtures Using Isocratic HPLC with Density Detection, J. Liquid Chromatogr. 13:95-105 (1990).
18. Lozano, P., N. Chirat, J. Graille, and D. Pioch, Measurement of Free Glycerol in Biofuels, Fresenius J. Anal. Chem. 354:319-322 (1996).
19. De Filippis, P., C. Giavarini, M. Scarsella, and M. Sorrentino, Transesterification Processes for Vegetable Oils: A Simple Control Method of Methyl Ester Content, J. Am. Oil Chem. Soc. 72:1399-1404 (1995).
20. Daun, J.K., and P. Williams, Near Infrared Analysis of Oilseeds: Current Status and Future Directions, in New Techniques and Applications in Lipid Analysis, R.E. McDonald and M.M. Mossoba, eds., AOCS Press, Champaign, 1997, pp. 266-282.
21. Sato, T., Application of Near Infrared Spectroscopy for the Analysis of Fatty Acid Composition, Lipid Technol. 9:46-49 (1997).
22. Holman, R.T., and P.R. Edmondson, Near-Infrared Spectra of Fatty Acids and Some Related Substances, Anal. Chem. 28:1533-1538 (1956).
23. McManis, G.E., and L.E. Gast, Near IR Spectra of Long Chain Vinyl Derivatives, J. Am. Oil Chem. Soc. 48:310-313 (1961).
24. Murray, I., The NIR Spectra of Homologous Series of Organic Compounds, Near Infrared Diffuse Reflectance/Transm. Spectrosc., Proc. Int. NIR/NIT Conf. 1986, J. Hollo, K.J. Kaffka, and J.L. Gonczy, eds., Akad. Kiado, Budapest, (1987), pp. 13-28.
25. Ozaki, Y., and Y. Liu, FT-NIR Spectroscopy of Some Long-Chain Fatty Acids and Alcohols, Macromol. Symp. 94:51-59 (1995).
26. Handbook of Chemistry and Physics, 66th edn., R.C. Weast, Editor-in-Chief, CRC Press, Boca Raton, FL, 1985.
27. Curtin, D.L., In-Process Analysis of Multifunctional Esters by NIR Spectroscopy, AT-Process 3:18-25 (1997).
28. Hansen, W.G., Shifting of -OH Absorption Bands on NIR Spectra of Esters, Appl. Spectrosc. 47:1623-1625 (1993).
29. Mockel, W.D., and M.P. Thomas, Determination of Transesterification Reaction Endpoint Using NIR Spectroscopy, Proc. SPIE--Int. Soc. 0pt. Eng. 1681:220-230 (1992).
30. Sadeghi-Jorabchi, H., V.M.E. Wood, F. Jeffery, A. Bruster-Davies, N. Loh, and D. Coombs, Estimation of Biodiesel in Lubricating Oil Using Fourier Transform Infrared Spectroscopy Combined with a Mid-Infrared Fibre Optic Probe, Spectrosc. Eur. 6:16,18,20-21 (1994).
31. Grob, R.L., D.J. Skahan, K. Dix, and K. Nielsen, Remote OnLine Monitoring of Polyol Production Using Near-Infrared Spectrophotometry, Process Control Qual. 2:225-235 (1992).
32. Jones, L.O., J.R. Noles, Jr., R.J.L. Chimenti, and H.L. Fang, Method for Controlling Polyol Esterification Using Near or Mid-Infrared Analysis, PCT Int. Appl. WO 9610009, April 4, 1996.
33. Janosch, J., and S. Ebel, Bestimmung von Fettkennzahlen mit Hilfe der NIR Spektrometrie, Pharmazie 48:824-828 (1993).
34. Conzen, J.P., Methodenvalidierung in der quantitativen NIR Spektroskopie (Method Validation in Quantitative NIR Spectroscopy), GIT Labor-Fachz. 42:97-98,101-102 (1998).
35. Freedman, B., E.H. Pryde, and T.L. Mounts, Variables Affecting the Yields of Fatty Esters from Transesterified Vegetable Oils, J. Am. Oil Chem. Soc. 61:1638-1643 (1984).
36. Freedman, B., R.O. Butterfield, and E.H. Pryde, Tranesterification Kinetics of Soybean Oil, Ibid. 63:1375-1380 (1986).
37. Boocock, D.G.B., S.K. Konar, V. Mao, and H. Sidi, Fast One-Phase Oil-Rich Processes for the Preparation of Vegetable Oil Methyl Esters, Biomass Bioenergy 11:43-50 (1996).
38. Boocock, D.G.B., S.K. Konar, V. Mao, C. Lee, and S. Buligan, Fast Formation of High-Purity Methyl Esters from Vegetable Oils, J. Am. Oil Chem. Soc. 75:1167-1172 (1998).
39. Noureddini, H., and D. Zhu, Kinetics of Transesterification of Soybean Oil, Ibid. 74:1457-1463 (1997).
[Received November 12, 1998; accepted March 29, 1999]
NIR Helps Turn Vegetable Oil into High-Quality Biofuel -- ARS News Release, June 15, 1999
Rapid Monitoring of Transesterification and Assessing Biodiesel Fuel Quality by Near-infrared Spectroscopy Using a Fiber-Optic Probe, by Gerhard Knothe, JAOCS 76, 795-800 (July 1999)
Monitoring a Progressing Transesterification Reaction by Fiber-Optic Near Infrared Spectroscopy with Correlation to 1H Nuclear Magnetic Resonance Spectroscopy, by Gerhard Knothe, JAOCS 77, 489-493 (May 2000)
Back to Biofuels Library Index
Biofuels
Biofuels Library
Biofuels supplies and suppliers
Biodiesel
Make your own biodiesel
Mike Pelly's recipe
Two-stage biodiesel process
FOOLPROOF biodiesel process
Biodiesel processors
Biodiesel in Hong Kong
Nitrogen Oxide emissions
Glycerine
Biodiesel resources on the Web
Do diesels have a future?
Vegetable oil yields and characteristics
Washing
Biodiesel and your vehicle
Food or fuel?
Straight vegetable oil as diesel fuel
Ethanol
Ethanol resources on the Web
Is ethanol energy-efficient?